
In modern business operations, data analysis has become a core tool for decision-making. However, many enterprises are still accustomed to relying solely on the MECE (Mutually Exclusive, Collectively Exhaustive) framework to disassemble the problem when conducting problem analysis, ignoring the support of data evidence. This kind of analysis can easily lead to a mere formality in decision-making, a lack of data foundation, and even the wrong strategy.
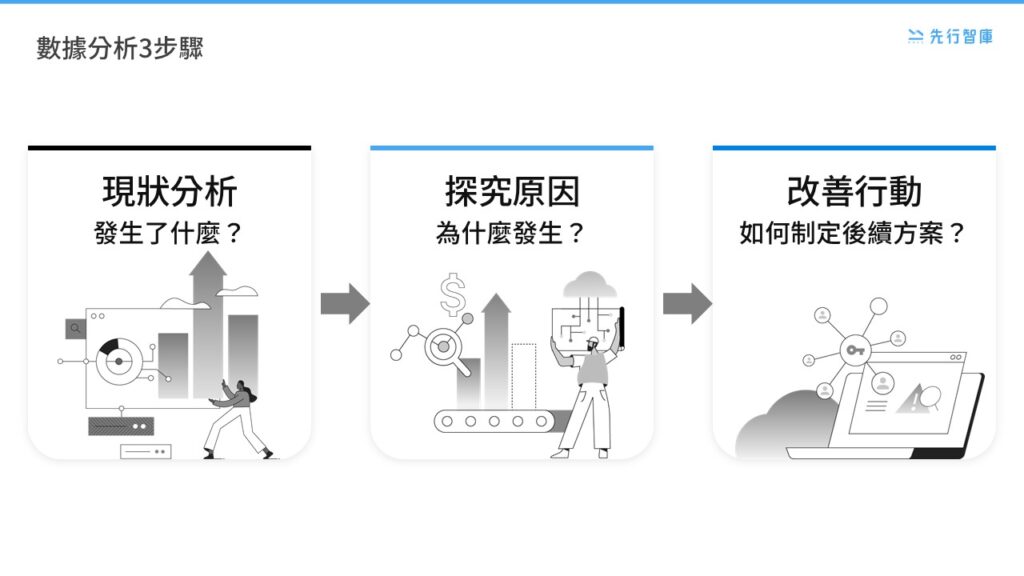
Truly effective problem analysis requires not only framework thinking, but also data as a support point. This article will focus on the three steps of data analysis: analysis of the current situation, exploration of causes, and improvement actions, to explain how to use data analysis to dismantle problems and make more convincing decisions.
In addition, we will combine the essence of the course “Data Problem Analysis and Report Interpretation” to help readers grasp the core steps of data analysis, how to interpret reports, and how to enhance the competitiveness of enterprises through data-driven decision-making.
我們將結合《數據問題分析與報表解讀》課程的精華內容,幫助讀者掌握數據分析的核心步驟、報表解讀方式,以及如何透過數據驅動決策,提升企業競爭力。
1. Analysis of the current situation: what happened?
The first step is to clarify the current situation and confirm the actual situation through the data report.
Many companies tend to assume what the problem is based on their intuition, such as “if a company finds that its revenue fell by 10% in the quarter, it may intuitively think that it is a market recession”, but this assumption is often one-sided. We should check the status quo through data reports. For example, you can collect the following data to confirm the current situation.
- Sales report: Confirm sales, product trends, changes in the number of customers.
- Financial Statements: Review revenues, costs and profits to ensure financial health.
- Marketing analytics reports: Track ad conversion rates, brand voice, and customer behavior.
- Inventory & Supply Chain Report: Check inventory levels and supply chain stability.
- Overall market trends: overall market size, peer sales
However, if you look for clues from the above data, you find that the number of customers is not declining, but the value of a single transaction is decreasing, which means that the problem may be a decrease in the average order value or a change in product mix, rather than a market problem. This shows that it is more accurate to confirm the current situation through data than to speculate.

2. Investigate the causes: Why did it happen?
Once the status quo is confirmed, the next step is to find the true cause of the problem.
This part is not just a logical deduction, but a need to verify the hypothesis through data cross-comparison and multi-layer analysis. We can use the following data analysis methods to find out the root cause of the problem. There are many ways to explore the causes, you can do comparative analysis (compare the current period with past data to find outliers), you can also do trend analysis (check the direction of data changes and predict future impacts), you can also do composition analysis (disassemble the data structure, such as distinguishing between new and old customers, product categories, etc.), and you can do hierarchical analysis (deep dismantling the data by different dimensions (region, channel, customer group)).
For example, if you find that the average order value is decreasing, the next step should be analyzed, is the sales of high-priced products decreasing? Or is it a decrease in the frequency of customer purchases? Do new customers have different consumption behaviors than old customers? Are competitors offering products at better prices?
At this point, the MECE framework can be used to enumerate possible causes, but ultimately it is up to the data to verify which factors have the greatest impact.

3. Improvement actions: How to formulate a follow-up plan?
Once the root cause of the problem is identified, an effective course of action can be developed.
Improvement actions need to be based on data, not on experience. We can verify the effectiveness of our actions in the following ways, such as data backtesting (simulating the impact of different strategies on the data to ensure that the plan is effective), KPI monitoring (setting key indicators to track the effectiveness of the action), and A/B testing (comparing the effects of different strategies through experiments to select the optimal strategy)
For example, if you find a drop in your average order value, possible improvements include: optimizing your product mix, launching promotions for products with a high unit price, and encouraging consumption upgrades. Or the price strategy is adjusted, comparing the market price, and adjusting the discount mechanism. It can also be strengthened by marketing activities, launching exclusive offers for loyal customers and increasing customer repurchase rates. But these strategies need to be verified by data, not decided by the head.

4. data is the foundation of problem analysis
The three steps of data analysis – analysis of the current situation, investigation of causes, and improvement actions – form a complete framework for data-driven decision-making.
Analysis of the current situation: Avoid intuitive speculation and confirm the real problem through data.
Explore the cause: Use data analytics to verify the root cause of the problem.
Improvement actions: Inform decision-making with data to ensure solutions are effectively solved.
If enterprises can master these three steps, they can avoid blind spots in decision-making and improve the accuracy and enforceability of decision-making. If you want to learn these skills in depth, you are welcome to take the “Data Problem Analysis and Report Interpretation” course to fully master the three steps of data analysis and practical skills in 12 hours, strengthen decision-making skills through case exercises, and learn how to obtain truly valuable business insights from data.
🚀 Let’s get out of the habit of making intuitive decisions and start truly data-driven problem analysis!
Learn more and master data-driven problem analysis skills!
If a company can master these three steps, it can avoid decision-making blind spots and enhance the accuracy and feasibility of its decisions. If you want to further develop your data-driven problem analysis skills, KSCC offers courses on data problem analysis and report interpretation. These courses combine practical exercises and case studies to help you extract valuable business insights from data, making your decisions more persuasive and effective.
If you have any questions or requests, please fill out the form below, and we will be happy to assist you! You can also explore more resources through the button below: