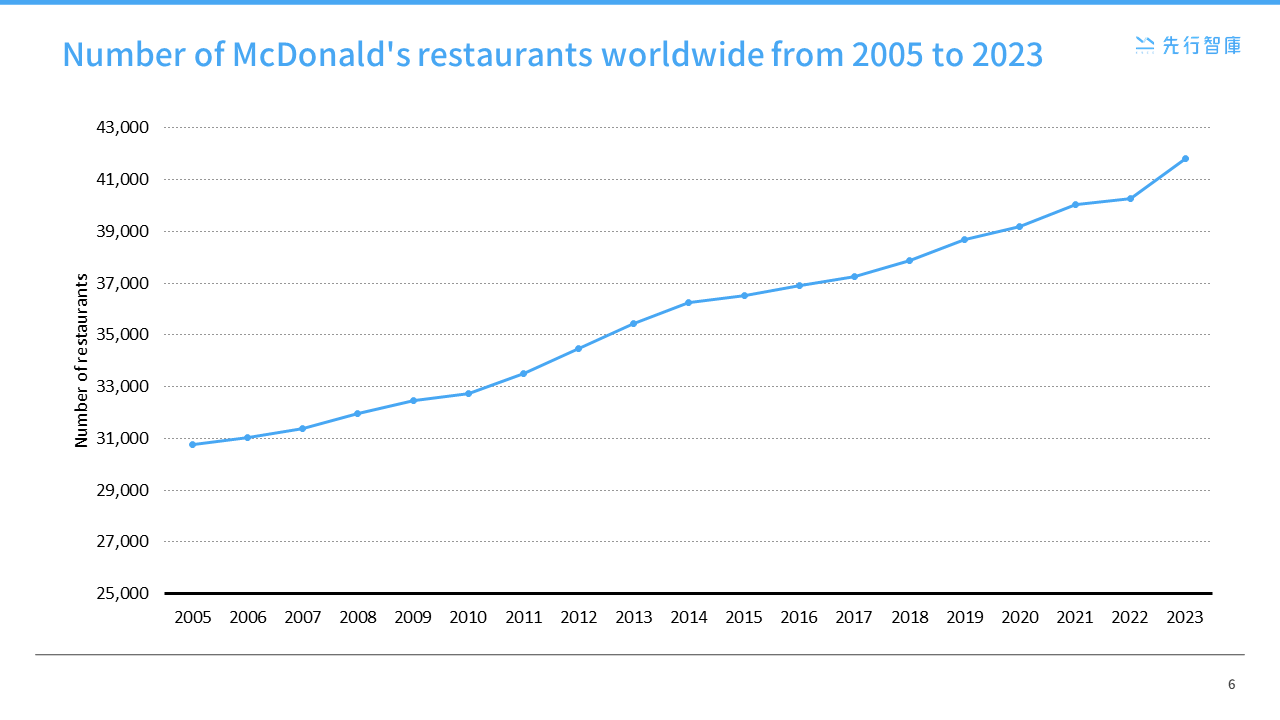
McDonald’s is a global leader in food and beverage services, and the number of stores worldwide has grown steadily over the past decade by constantly listening to the voice of customers and understanding market changes. This success story tells us that in an era of rapidly changing consumer preferences, F&B operators must accurately grasp the voice of consumers and important feedback in order to stand out in the highly competitive F&B industry. In this article, we will introduce how to use Power BI, a data analysis tool, to help F&B operators accurately analyze customer satisfaction.
Why use Power BI to analyze customer satisfaction?
Many F&B businesses currently use QR codes to fill out questionnaires to survey customer satisfaction with meals, using tools such as Surveycake and Google Forms. However, the built-in questionnaire analysis charts of these tools are generally available and cannot fully meet the management needs of the catering industry.
If the industry has specific data calculation habits, it is often necessary to export the data to Excel for complex calculations. In addition, the built-in charts don’t provide an analysis of the monthly satisfaction trend changes, and finding out which rating items have low ratings requires cross-checking charts and Excel breakdowns, which can be time-consuming. To address these issues, restaurateurs need a more efficient tool to interpret the vast amount of customer satisfaction data.

Power BI Template
With Power BI, we can grasp the following topics more accurately and quickly:
Understand year-over-year/month-to-month trends in overall customer satisfaction
What are the key reasons for the plummeting level in satisfaction? Or which services?
Who are the less equal customers for different dishes or services? What are their profiles and how to contact them?
If you display customer satisfaction data in Power BI, you can make the following presentation:

If you want to dynamically cross-analyze the dashboard, you can follow the following approach: start with the key metrics in the upper left corner and see if the numbers deviate from the normal values. If so, look at the trend on the right chart and analyze whether it is a short-term anomaly or a long-term phenomenon. Then look at each rating item on the right to find the one with the lower rating item (which will lower the overall average). Finally, you can scroll down to see the details of customer fillings to see which customers gave poor ratings, and further phone care.

With the help of Power BI and the above analysis logic design, you will be able to grasp the key to customer satisfaction. With this dashboard, you’ll be able to replicate what’s good and improve what’s not perfect.
Analyze the benefits of meal satisfaction
By analyzing customer satisfaction with meals through Power BI, the following results can be achieved:
- Enhance the customer experience: Analyzing customer satisfaction can help restaurants understand what needs to be improved to improve the overall customer experience. By understanding customer feedback, restaurants can adjust to the quality of dishes, service levels, restaurant environment, etc., so as to meet customer needs, increase customer satisfaction and loyalty, and ultimately improve the reputation and competitiveness of the restaurant.
- Improve business efficiency: Understanding customer satisfaction can help restaurants optimize resource allocation and reduce waste. Through data analysis, restaurants can find out which dishes are popular and which service links need to be strengthened, and then make targeted improvements to improve work efficiency and service quality, so as to attract more repeat customers, increase revenue, and maximize business efficiency.
- Develop a marketing strategy: By analyzing customer satisfaction data, restaurants can better understand customer preferences and market trends, and develop precise marketing strategies. The results can help restaurants identify which promotions work best and which have the most potential, so as to target customers in marketing, increase market penetration, attract more new customers, and achieve long-term growth.
KSCC is a management consulting company in Taiwan. Our services include corporate in-house training, consulting, and leadership management.For more information about our corporate services, please feel free to visit our website: https://kscthinktank.com.tw/custom-training/