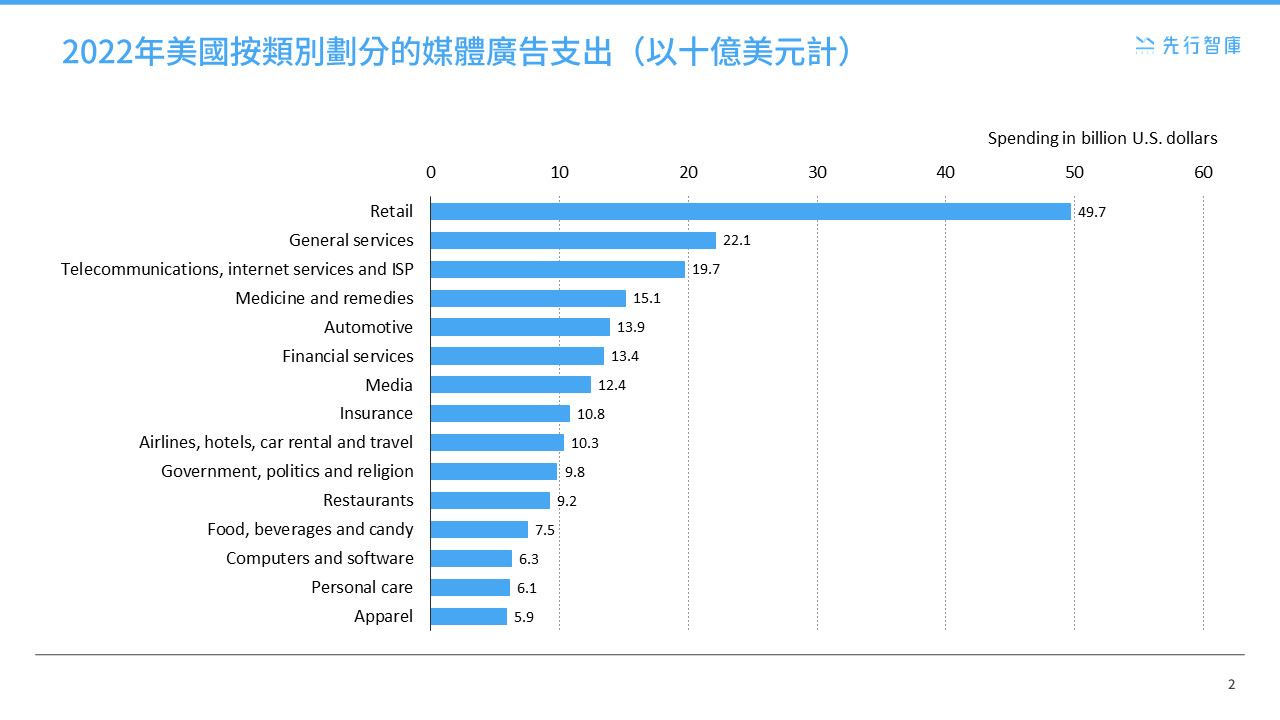
In 2022, the retail industry in the United States led the pack in media advertising expenditures, reaching a staggering $49.7 billion, with the service sector following at $22.1 billion. Given such fierce market competition, every click on an advertisement can potentially make or break a business.
For industries targeting a broad customer base, advertising is not just a tool for brand promotion; it is a critical strategy for quickly reaching and converting potential customers. So, how can we navigate the vast ocean of data to find a successful course for ad placements? This article will uncover how to measure the effectiveness of advertising using data and delve deep with Power BI to analyze advertising data, helping businesses gain a competitive edge on the digital battleground with precise strategies and insights, thereby attracting a steady stream of customers.
1、The importance of managing advertising data
In the landscape of digital marketing, managing advertising data plays an indispensable role. It’s not just about recording and tracking; it serves as a strategic tool that helps businesses precisely target, enhance return on investment (ROI), and ultimately achieve their business goals. Here are the four core values of advertising data management:
- Precision Targeting: Data analysis enables businesses to deeply understand the characteristics and behaviors of their target customer groups, ensuring that advertisements reach the right audience at the optimal time and on the most effective platforms.
- Increased Efficiency: Effective data management quickly identifies which advertising channels and creative strategies are the most effective, thereby saving unnecessary costs and enhancing the overall performance of the advertisements.
- Real-Time Adjustments: As market conditions change rapidly, real-time data feedback allows businesses to quickly adjust their strategies to respond to market changes and maintain competitiveness.
- Enhanced Transparency: Detailed data reports allow businesses to clearly see every dollar spent and its output, thereby better controlling and optimizing the advertising budget.
The following table summarizes the characteristics of various major advertising channels, so that companies can choose the most suitable advertising strategy according to their own needs and goals, and continuously optimize the advertising effect through refined data management to maximize their market influence and return on investment. Advertising data management is not only a technical operation, but also a strategic thinking. Anyone who can learn to speak with data can make a brand stand out from the crowd in the fierce competition.
| Advertising Channels | characteristic | merit | shortcoming |
| Search Engine (SEA) | Search based on keywords | High conversion rate and precise targeting | Competition is fierce and click-through costs are high |
| Social ads | Behavior based on user interests | High coverage and high interactivity | Susceptible to ad-blocking tools |
| Sent directly to the target user | High rate of return and strong personalization | It is easy to be dismissed as spam | |
| Native advertising | Blend in with the content | The user experience is good and the acceptance is high | It needs to be carefully designed and costly |
| Video commercials | Visual-auditory attraction | High attraction and strong sharing | The production cost is high and the effect evaluation is complicated |
2、How to accurately measure the effectiveness of advertising with data? Six ways to advertise efficiency
Want to know if your advertising strategy is really hitting your target customers? Follow these six useful indicators to find out:
- Appeal of advertising channels: Explore which advertising channels attract the most potential target audience to understand which platforms best reach our target market.
- Lead generation: Analyze how many leads these advertising channels can bring, i.e., the number of specific inquiries, to evaluate the actual effectiveness of each channel.
- Customer Engagement Channels: Investigate the channels through which a prospect first engages with us to optimize the efficiency and usability of those touchpoints.
- Store or location differences: Comparing potential customers in different stores or locations can help tailor your strategy to a specific region.
- Ad-to-ask conversion rate: A measure of how much of a person asks for a relevant message after seeing an ad on the web, which reflects the appeal and relevance of the ad content.
- Inquiry-to-store conversion rate: Analyze what percentage of potential customers actually visit your store after an inquiry, which is an important metric for evaluating the final conversion performance of your ads.
3、Two examples of the Digital Marketing Power BI dashboard are shown
Next, we will take two Power BI dashboard examples as examples to show how to combine BI tools to help us do data analysis and decision-making. The chart below is an analytics dashboard on the number of online inquiries, which allows you to pinpoint which online channels are attracting the most inquiries from potential customers, allowing you to allocate your advertising budget more precisely. There are several analysis highlights included in the dashboard:
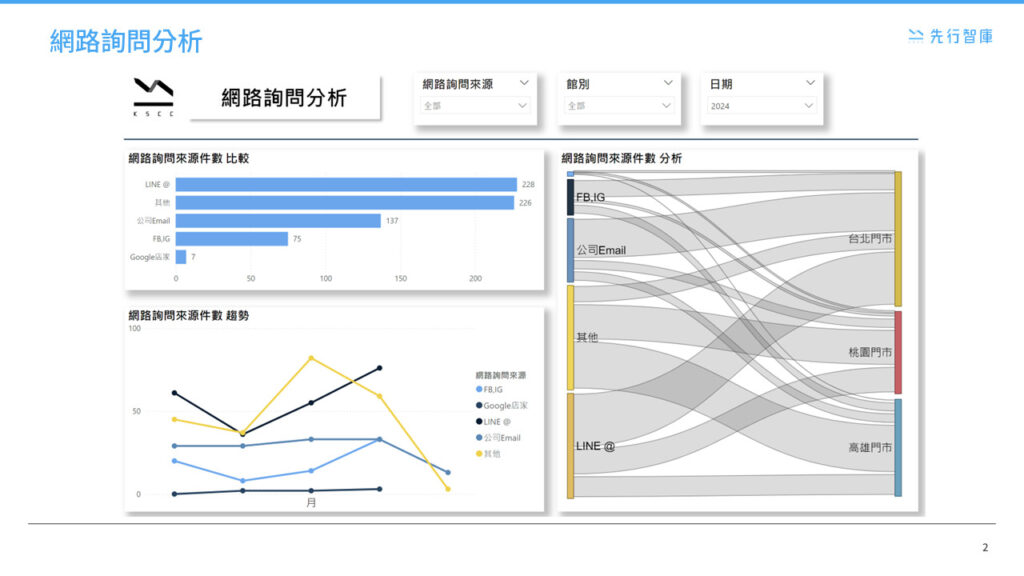
- Analysis of the main contact channels: The graph in the upper left corner includes the number of inquiries from the five major channels, including Line@, Facebook, Instagram, and Email, to help us understand the return on advertising budget of each channel. For example, Line@ has nearly twice as many inquiries as Facebook and Instagram, suggesting that our Line@ conversion efficiency is higher and worth the more investment.
- Trend Analysis: The graph in the lower left corner helps us understand the trends in detail for each source of customer inquiry. For example, although Line@ contributed the most inquiries, the trend was to decline and then rise. This suggests that in addition to comparing the total number of queries, we should also conduct trend analysis to get a more complete interpretation of the data.
- Inquiry source: Sankey map can reveal the channels through which different stores or museums usually receive inquiries. For example, the data in Taipei stores shows that inquiries are mainly received through company email and Line@. This analysis helps us improve customer engagement and overall conversion performance, which in turn improves our performance.
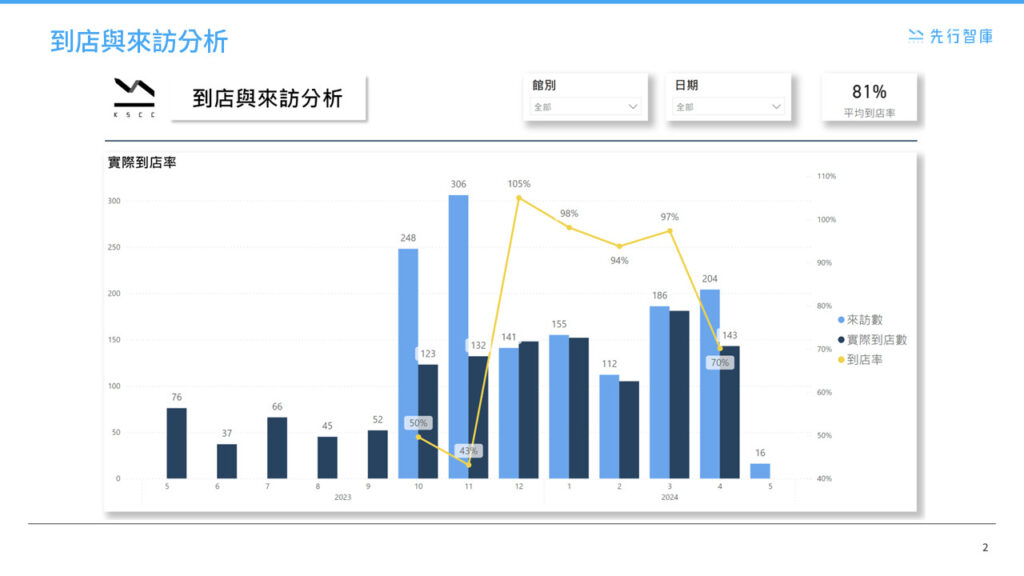
In addition, it is possible to analyze the visits and visits of the store as shown in the figure below to more accurately grasp how many of the customers actually came to the store. Through analysis, you can identify if there are problems in the inquiry process, such as inappropriate responses or insufficient information provided, which may lead to low conversion rates in actual store visits. Such insights can help improve customer engagement strategies and increase conversions.
4、Analyze the top 3 benefits of marketing data with Power BI
Using Power BI to analyze advertising data can dramatically improve the efficiency and effectiveness of your marketing strategy. Here are the three main results you can achieve when you analyze your ad results with this powerful tool:
- Boosting ROI on Advertising Budgets: By using a dashboard to analyze online inquiry data, companies can identify which channels are attracting the most potential customer inquiries, allowing for more precise budget allocation. Data analysis reveals the volume of inquiries from different channels and their trends, enabling companies to adjust their ad spend based on actual performance. For instance, if one platform shows significantly higher inquiries than others, it might be wise to increase ad investment there to maximize overall advertising impact and return on investment.
- Optimizing Customer Interaction and Service Strategies: Data analysis not only identifies the most effective channels but also highlights potential issues in customer interaction, such as inappropriate responses or insufficient information. This allows companies to address these issues by adjusting their customer service strategies or enhancing the quality of information provided, thereby improving customer satisfaction and conversion rates.
- Understanding Customer Behavior Across Locations: Visualization tools like Sankey diagrams can show how customers at different stores or branches inquire through various channels. This analysis helps gain deeper insights into customer behavior patterns in different regions or branches. Companies can use these insights to tailor their marketing strategies for specific locations or stores, ensuring each one attracts and serves customers in the most effective way possible.
KSCC is a management consulting company in Taiwan. Our services include corporate in-house training, consulting, and leadership management.For more information about our corporate services, please feel free to visit our website: https://kscthinktank.com.tw/custom-training/